11, June 2026
You read this right. Canada has been ranked #1 in innovation by the OECD.
We have become accustomed to seeing Canada ranked dismally for innovation in rankings such as the Global Innovation Index (#17 overall), market sophistication (#8), creative outputs (#24), institutions (#15), infrastructure (#24).
In the closely related World Competitiveness Ranking 2025 Canada ranks #11 overall, land area (#1), government efficiency (#11), economic performance (#14), business efficiency (#13)
Every two years the OECD updates its Business Innovation Statistics Database, using survey data collected according to the Oslo Manual in its 33 member countries and seven key partner and accession countries. This methodology provides comparability for data collected in different countries. This update covers the period 2020-2022. The definition of an innovative enterprise is one that reported having introduced a new or improved product or business process.
The graph below shows the percentage of enterprises active in innovation. Canada ranks #1. Canada also ranked #1 in the previous period examined, 2018-2020.
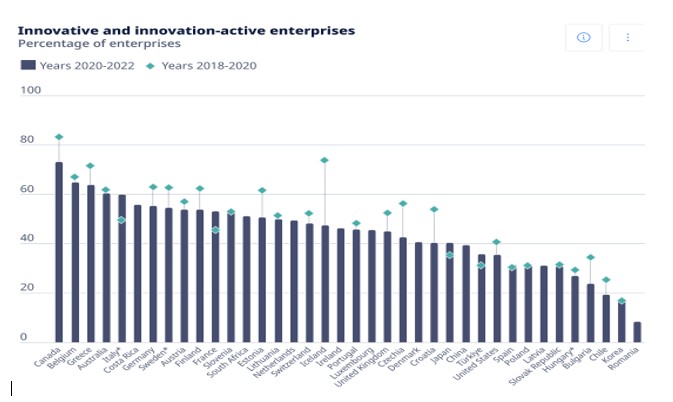 Source: OECD Business Innovation Statistic’s Database.
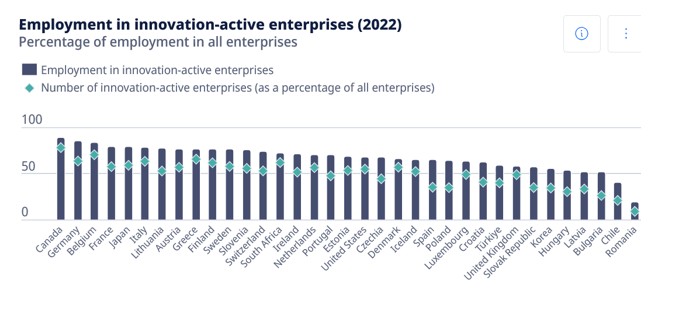
The OECD also tabulates the percentage of employment that is in innovative enterprises. The graphic below shows that Canada is ranked #1 here also.
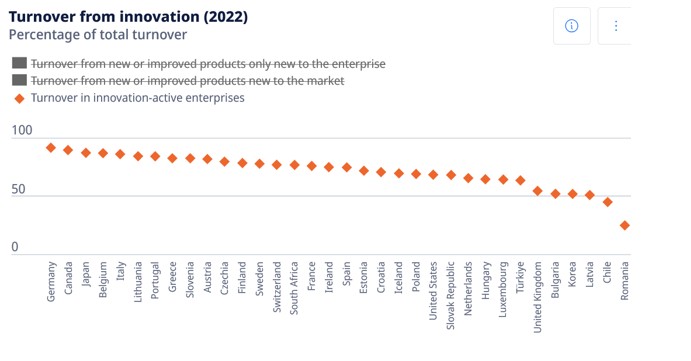
Canada also ranks highly in ranking of total turnover (sales revenue) that is attributed to innovative companies. See the graphic below. In this ranking Canada ranks at #2, behind Germany.
Looking at the breakdown by industry, Canada ranks very strongly in ICT and manufacturing of food products, as well as all economic activities covered, measured by the percentage of enterprises in each industry that are innovative.
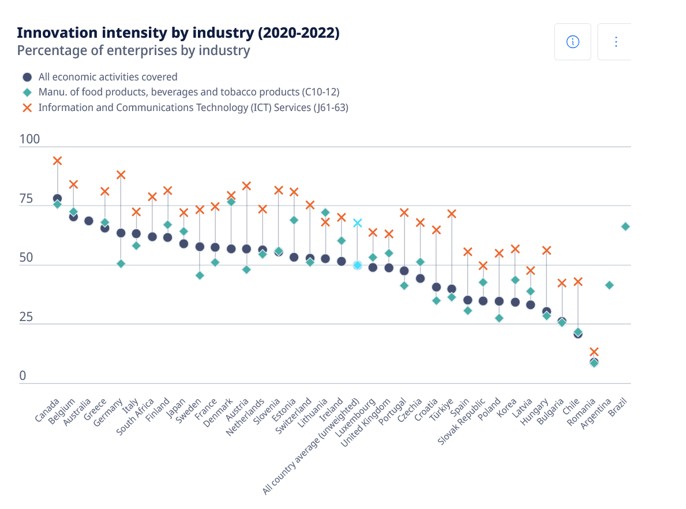
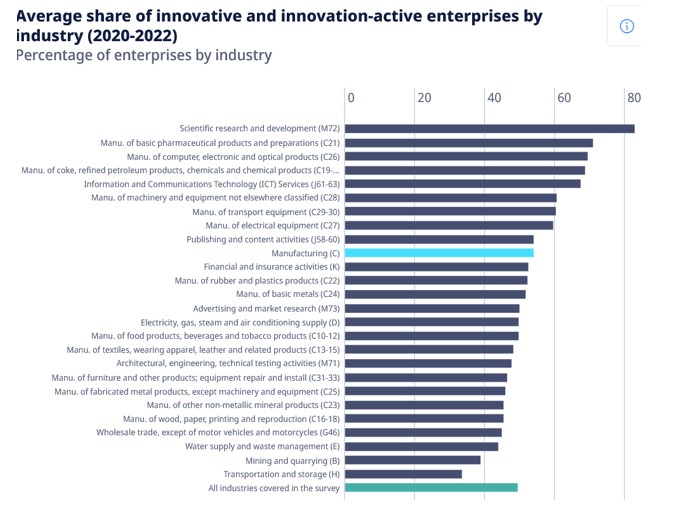
Across all the OECD countries, innovative activity varies a lot between industries. The graphic below shows the average for all OECD countries. As you might expect the highest rated were scientific research and development and pharmaceutical manufacturing, and the lowest ones include transportation and storage and mining and quarrying.
Digging deeper.
If you look at Statistics Canada data, innovative activity varies a lot by firm size. Large companies are most innovative (66.5% are innovative) medium sized firms less (53.7% are innovative, and small forms are least innovative (at 45%)
Multinational firms are significantly more innovative than domestic firms (85.6% compared with 69.8%)
According to Statistics Canada, 47.2 % of enterprises in Canada conducted “Innovative Activities” in 2022.
What measure is better?
The OECD measures the percentage of enterprises that introduced at least one new or improved product or business process in a three-year window (2020-2022), while the Statistics Canada data measures businesses that conducted innovation activities during 2022.
Which measure is better? A very strong case can be made that if you want to measure innovation you should measure output measures rather than input measures, as that is a measure of what was actually implemented in the market. Output measures would be, for example, new products or services, while input measures would be activities such as research and development, software development or specialized employee training. By this criterion, the OECD metrics from the Business Innovation Statistics Database are a better measure of innovation that the measure of innovative activities.
Why don’t more new products translate into better productivity?
Productivity is about output per worker, and this may or may not be connected with new products. For example, if a car factory finds a way to speed up the production line that improves productivity while making the same product. On the other hand, if a restaurant introduces a new product (say a new flavour of ice cream) that may have no effect at all on their overall productivity.
New products or processes can be incremental (for example the new flavour of ice cream) disruptive (for example the digital camera) or transformative (for example, the computer or steam engine.) We have no data on this, but it is highly likely that the vast majority of the new products reported in the OECD survey are incremental.
The main driver of increased productivity is technological innovation. But it’s not just the introduction of the new technology, it’s the widespread adoption and modification of business processes and people’s skills that produces the benefit.
Conclusion.
It was British Prime Minister Disraeli who is said to have coined the phrase “Lies, damned lies and statistics” to make the point that raw data requires context and understanding for proper interpretation, and without that it can be misleading.
The relationship between new products, innovation and increased productivity is complicated.
It is interesting to note that Switzerland, ranked #1 for innovation and competitiveness in most reports, is ranked in the middle of the pack for new products and services. And the US is fourth quartile for production of new products and services in the OECD survey.
So, while it’s nice to see Canada raked #1 for something, it probably doesn’t have that much significance.
Peter
Leave A Comment
You must be logged in to post a comment.